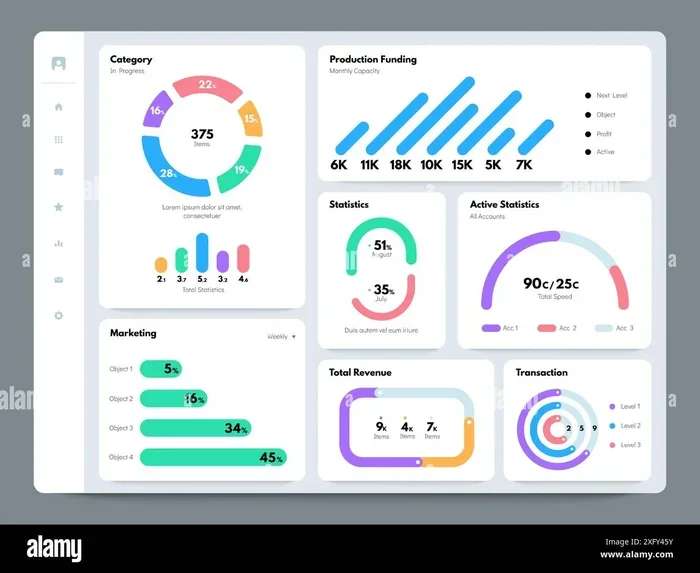
Self Service Data Analytics Tools for Smarter Decisions
Self service data analytics tools let anyone in your team explore data and find insights without needing a tech expert. These platforms use simple drag-and-drop features and clear dashboards so you can make data-driven decisions fast. This guide covers the top tools, how to pick the right one, and tips to get started today.
Imagine walking into your office and answering your own data questions in minutes. No waiting for a report. No emailing the IT team. No spreadsheets that crash. That is the power of self service data analytics tools. These platforms give everyday business users the ability to explore data, build dashboards, and uncover insights without writing a single line of code.
More and more companies are turning to these tools because the old way just does not work. Traditional analytics required specialized teams, long wait times, and big budgets. Today, self-service analytics puts the power directly into the hands of people who know the business best. Whether you run a small startup or a large enterprise, the right tool can change the way you work.
In this guide, we will walk you through everything you need to know. We will cover what these tools are, why they matter, which ones to look at, and how to choose the best fit for your team. By the end, you will have a clear path forward to smarter, faster decisions.
Key Takeaways
- No coding needed: Self service analytics tools let regular business users explore and visualize data on their own.
- Faster decisions: Real-time insights help teams react quickly to changes and spot opportunities early.
- Wide range of tools: From Tableau to Power BI, there is a platform for every budget and skill level.
- Easy to start: Most platforms offer free trials and simple onboarding so you can test them risk-free.
- Data governance matters: Even with self service, you still need clear rules about who can see what data.
- Boosts team independence: Business users stop waiting on IT and start solving problems on their own.
📑 Table of Contents
What Are Self Service Data Analytics Tools?
Self service data analytics tools are software platforms that let non-technical users access, explore, and visualize data on their own. Think of them as a bridge between raw data and real business insights. Instead of relying on data scientists or IT departments, anyone with basic computer skills can dive into the numbers.
These tools typically feature drag-and-drop interfaces, pre-built templates, and natural language queries. You do not need to know SQL or Python. You just point, click, and explore. The best platforms also offer data visualization features that turn complex numbers into clear charts and graphs.
How They Work
Most self-service platforms follow a simple process. First, you connect to a data source. This could be a spreadsheet, a database, or a cloud app. Next, you clean and prepare the data using built-in tools. Then you build visuals and dashboards. Finally, you share your findings with the team.
The whole process is designed to be intuitive. Many platforms use machine learning to suggest insights automatically. For example, the tool might flag a sudden drop in sales or highlight a trend you missed. This makes data exploration fast and even fun.
Key Features to Look For
Not all analytics platforms are created equal. Here are the features that matter most:
- Easy data connection: The tool should link to multiple data sources without hassle.
- Intuitive interface: A clean, simple design that anyone can learn quickly.
- Real-time updates: Live data feeds so your insights stay current.
- Sharing and collaboration: Easy ways to share dashboards with teammates.
- Mobile access: The ability to check insights from your phone or tablet.
- Security controls: Role-based access to keep sensitive data safe.
Why Self Service Analytics Matters for Business
The business world moves fast. Decisions that used to take days now need to happen in hours. Self-service analytics gives teams the speed and flexibility they need to stay competitive. When business users can access data on their own, everyone wins.
Faster Decision Making
Waiting for a data team to run a report can take days or even weeks. With self service data analytics tools, you get answers in minutes. Need to check last quarter’s sales? Pull it up yourself. Want to see how a marketing campaign performed? Build a dashboard in seconds.
This speed matters. When you can act fast, you catch opportunities before they disappear. You also fix problems before they grow. Real-time insights give your team a real edge.
Empowering Every Team Member
Not everyone on your team is a data expert, and that is okay. Self-service analytics levels the playing field. Marketing teams can track campaign results. Sales teams can monitor pipeline health. Operations teams can spot bottlenecks. Everyone becomes a little more data-literate.
This idea is sometimes called democratizing data. It means giving everyone access to the information they need to do their jobs better. When people can explore data themselves, they feel more confident and more engaged.
Reducing IT Bottlenecks
Let us be honest. IT teams are always stretched thin. Every request for a report or a new dashboard adds to their workload. Self-service tools take a lot of that burden away. Business users handle their own data preparation and reporting, freeing IT to focus on bigger projects.
This does not mean IT becomes less important. Far from it. IT still plays a key role in managing data sources, setting up security, and ensuring data quality. But the day-to-day analytics work shifts to the people who actually use the data.
Top Self Service Data Analytics Tools to Consider
The market is full of options, which can make choosing hard. Here are some of the most popular analytics platforms that business users love.
Tableau
Tableau is one of the most well-known names in business intelligence. It offers a powerful drag-and-drop interface and stunning visualizations. The desktop version is great for deep data exploration, while Tableau Online and Server handle sharing and collaboration.
Tableau works well for teams that want advanced analytics without heavy coding. It connects to almost any data source and handles large datasets with ease. The learning curve is moderate, but the results are worth it.
Microsoft Power BI
Power BI is a favorite among companies already using the Microsoft ecosystem. It integrates smoothly with Excel, SharePoint, and Azure. The drag-and-drop interface is user-friendly, and the price point is very competitive.
One of Power BI’s biggest strengths is its natural language queries. You can type a question like “What were sales last month?” and the tool builds a visual for you. This makes it a great choice for teams new to self-service analytics.
Looker
Looker stands out for its strong data modeling capabilities. It uses LookML, a modeling language that lets teams define metrics and dimensions once. After that, anyone can explore the data without worrying about consistency.
Looker is ideal for larger organizations that need data governance at scale. It ensures everyone is looking at the same numbers in the same way. The trade-off is a steeper learning curve and a higher price tag.
Domo
Domo is a cloud-based platform built for speed. It connects to hundreds of data sources out of the box and offers real-time dashboards. The interface is clean and modern, making it easy for new users to get started.
Domo also includes built-in data preparation tools and app marketplace. You can extend its functionality with add-ons for specific needs. It is a strong choice for teams that want an all-in-one analytics platform.
Other Notable Tools
Beyond the big names, several other platforms deserve attention:
- Qlik Sense: Great associative engine that finds hidden patterns in your data.
- Sisense: Handles complex data blends and large-scale enterprise analytics.
- Zoho Analytics: A budget-friendly option with solid reporting tools and AI features.
- Sigma Computing: A newer tool with a spreadsheet-like interface that feels familiar.
How to Choose the Right Tool for Your Needs
Picking the right self service data analytics tool depends on your specific situation. Here are the factors you should weigh before making a decision.
Consider Your Team’s Skill Level
If your team is new to analytics, start with a tool that has a gentle learning curve. Power BI and Domo are great for beginners. If your team already has some experience, you might consider Tableau or Looker for more advanced features.
Think about who will use the tool. Is it just a few power users? Or do you want citizen data scientists across the organization? Your answer shapes the right choice.
Think About Your Data Sources
Not every tool connects to every data source. Before you commit, check that the platform supports your databases, cloud apps, and file types. Most tools list their integrations on their websites. Make a list of your current data sources and cross-reference them.
Also think about future needs. Will you add new data sources next year? Choose a tool that can grow with you.
Budget and Pricing
Pricing varies a lot across platforms. Some charge per user per month, while others have flat-rate plans. Free versions exist for tools like Power BI Desktop and Tableau Public. Here is a quick comparison to help you decide:
| Tool | Pricing Model | Starting Price | Best For |
|---|---|---|---|
| Power BI | Per user/month | $10/user | Microsoft users on a budget |
| Tableau | Per user/month | $15/user | Teams wanting advanced visuals |
| Looker | Custom pricing | Contact sales | Large enterprises |
| Domo | Per user/month | $60/user | All-in-one cloud platform |
| Zoho Analytics | Per user/month | $24/user | Small businesses |
Ease of Setup and Deployment
Some tools take days to set up. Others take weeks. Cloud-based platforms like Domo and Power BI are usually faster to deploy. On-premise solutions like Tableau Server require more IT involvement. Consider your team’s resources and timeline when evaluating.
Scalability
Choose a tool that can handle your current data volume and grow with your business. If you expect data to double in the next year, make sure your chosen platform can keep up without performance issues.
Getting Started with Self Service Analytics
Ready to dive in? Here is a simple roadmap to get your team up and running with self service data analytics tools.
Step 1: Define Your Goals
Before you pick a tool, know what you want to achieve. Are you trying to reduce costs? Improve customer retention? Track marketing ROI? Clear goals help you choose the right features and avoid wasting time on things that do not matter.
Step 2: Pick Your Tool
Use the factors we covered above to narrow down your options. Most platforms offer free trials. Take advantage of them. Test with a small dataset and see how the tool feels. Does it work for your team? Is the interface intuitive?
Step 3: Prepare Your Data
Clean data is the foundation of good analytics. Before connecting to your chosen platform, make sure your data is organized and consistent. Remove duplicates, fix formatting issues, and fill in missing values. Good data preparation saves you headaches later.
Step 4: Train Your Team
Even the easiest tools need some training. Start with a basic workshop that covers navigation, dashboard building, and data exploration. Most platforms offer free tutorials and certifications. Encourage your team to practice and explore on their own.
Step 5: Build a Culture of Data
The real magic happens when data-driven decisions become part of your daily workflow. Share dashboards in team meetings. Celebrate wins that came from data insights. Make it clear that everyone is encouraged to explore the numbers.
Over time, you will see a shift. People stop asking “What does the data say?” and start asking “What should we do based on the data?” That is the goal.
Quick Tips for Success
- Start small with one team or one project. Do not try to roll out to everyone at once.
- Pick a tool that matches your existing tech stack to reduce friction.
- Assign a data champion in each team to help others get started.
- Set up regular review sessions to discuss insights from dashboards.
- Keep your data sources clean and well-organized from the start.
Common Mistakes to Avoid
Even with the best tools, teams can stumble. Here are some common pitfalls to watch out for.
Skipping Data Governance
Self-service does not mean no rules. Without data governance, you risk inconsistent numbers and confused users. Set clear guidelines on who can access what data and how metrics should be defined.
Overcomplicating Dashboards
It is tempting to add every chart and metric to a dashboard. Resist that urge. A good dashboard tells a clear story. Focus on the key metrics that drive action. If a chart does not help someone make a decision, remove it.
Ignoring Data Quality
Garbage in, garbage out. If your source data is messy, your insights will be wrong. Invest time in data cleaning and validation before building dashboards.
Forgetting to Share Insights
A dashboard that nobody sees is just a pretty picture. Make sharing a habit. Use built-in collaboration features to let teammates comment, ask questions, and build on each other’s work.
Final Thoughts
Self service data analytics tools have transformed the way businesses operate. They put powerful business intelligence capabilities into the hands of everyday users. No more bottlenecks. No more waiting. Just fast, clear insights that drive real action.
The right tool depends on your team, your budget, and your goals. But the important thing is to start. Pick a platform, explore your data, and see what insights emerge. You might be surprised by what you find.
Remember, data-driven decisions are better decisions. And with these tools, better decisions are within everyone’s reach. So take that first step today. Your team and your bottom line will thank you.
And while you are setting up your analytics workspace, do not forget about the physical infrastructure that supports it. Reliable power keeps your servers and workstations running without interruption. If your office setup needs an upgrade, check out what size generator for 400 amp service would keep your systems running smoothly. Also, if your team uses power tools for equipment setup, matching the right generator ensures everything operates without issues.
Frequently Asked Questions
What exactly are self service data analytics tools?
Self service data analytics tools are software platforms that let non-technical users explore, analyze, and visualize data without needing help from IT or data teams. They use simple interfaces like drag-and-drop and natural language queries so anyone can build dashboards and find insights on their own.
Who benefits most from self-service analytics?
Business users across all departments benefit the most. Marketing teams track campaigns, sales teams monitor pipelines, and operations teams spot inefficiencies. Even managers and executives use these tools to make quicker, better-informed decisions without waiting for reports.
Do I need coding skills to use these tools?
No. That is the whole point of self-service analytics. These platforms are designed for people with no technical background. You do not need to know SQL, Python, or any programming language. The interface guides you through every step of the process.
How much do self-service analytics tools cost?
Costs vary widely. Some tools like Power BI Desktop are free. Others like Tableau or Domo range from $10 to $60 per user per month. Enterprise solutions like Looker often require custom pricing based on your organization’s size and needs.
Can small businesses use self-service analytics tools?
Absolutely. Many platforms offer plans designed for small businesses with affordable pricing and easy setup. Tools like Zoho Analytics and Power BI are particularly popular with smaller teams because they balance features with simplicity and cost.
What is the difference between self-service analytics and traditional analytics?
Traditional analytics requires a dedicated data team to run queries, build reports, and deliver insights. Self-service analytics puts those capabilities directly into the hands of business users. This means faster access to information, less dependency on IT, and more agile decision-making across the organization.
=== CONCLUSION ===
Self service data analytics tools are no longer a luxury. They are a necessity for any business that wants to stay competitive. These platforms give your team the power to explore data, uncover insights, and make better decisions every single day. The key is to start simple, pick the right tool, and build a culture where data is everyone’s responsibility.
With the right approach, you will see faster decisions, stronger teams, and clearer direction. So take the leap. Explore your options, try a free trial, and discover what self-service analytics can do for you.