How to Use Dev Tools in Chrome to Supercharge Your Workflow
Chrome Dev Tools is a powerful built-in browser toolset that lets you inspect, debug, and optimize websites directly in your browser. Whether you are a beginner or a seasoned developer, mastering how to use dev tools in chrome will save you hours of work and help you build better websites faster. This guide walks you through every essential feature with practical, easy-to-follow steps.
You have probably heard about Chrome Dev Tools before. Maybe someone told you they are a game-changer for web development. Or maybe you have seen the tiny “F12” shortcut and wondered what all the fuss is about. Either way, you are in the right place.
How to use dev tools in chrome is one of the most valuable skills you can build. These built-in tools come free with every copy of Google Chrome. They let you inspect elements, debug code, analyze network activity, and so much more. The best part? You do not need to install anything extra. Everything is already there, waiting for you.
In this guide, we will walk through every major panel and feature step by step. You will learn practical tips that you can use right away. By the end, you will wonder how you ever worked without them. Let us dive in.
Key Takeaways
- Element Inspection: Quickly view and edit HTML and CSS in real time to see changes instantly.
- JavaScript Debugging: Use the Sources panel to set breakpoints and trace errors with ease.
- Network Analysis: Monitor all network requests to find slow-loading resources and fix bottlenecks.
- Performance Profiling: Identify rendering issues and memory leaks with the Performance and Memory tabs.
- Mobile Emulation: Test responsive designs right inside Chrome without needing extra devices.
- Workflow Shortcuts: Learn keyboard shortcuts and custom workflows that dramatically speed up your daily routine.
📑 Table of Contents
- What Are Chrome Dev Tools?
- Opening Dev Tools and Understanding the Layout
- Inspecting and Editing Elements
- Using the Console for JavaScript Debugging
- Mastering the Network Tab
- Performance Profiling and Optimization
- Mobile Emulation and Responsive Testing
- Workflow Tips and Shortcuts
- Common Mistakes and How to Avoid Them
- Conclusion
What Are Chrome Dev Tools?
Chrome Dev Tools is a set of web developer tools built directly into the Google Chrome browser. Think of it as a Swiss Army knife for anyone who works with websites. Whether you are building a site, fixing a bug, or just curious about how a page works, these tools have you covered.
The tools open right inside your browser window. You do not need any extra software. Just press F12 or right-click anywhere on a page and select “Inspect.” That is all it takes to get started.
Why Should You Care?
Here is the honest truth. Most people browse the web without ever thinking about what happens behind the scenes. But if you build or manage websites, understanding what is under the hood is essential. Chrome Dev Tools gives you a window into that hidden world. You can see every element, every script, every request a page makes. This knowledge alone can transform the way you work.
Opening Dev Tools and Understanding the Layout
Before you can start using Chrome Dev Tools, you need to know how to open them. There are several easy ways to do this. Once you know how, you will never forget it.
Three Ways to Open Dev Tools
- Keyboard Shortcut: Press F12 on Windows or Command + Option + I on Mac.
- Right-Click Menu: Right-click anywhere on a webpage and choose “Inspect.”
- Chrome Menu: Click the three dots in the top-right corner, go to More Tools, then Developer Tools.
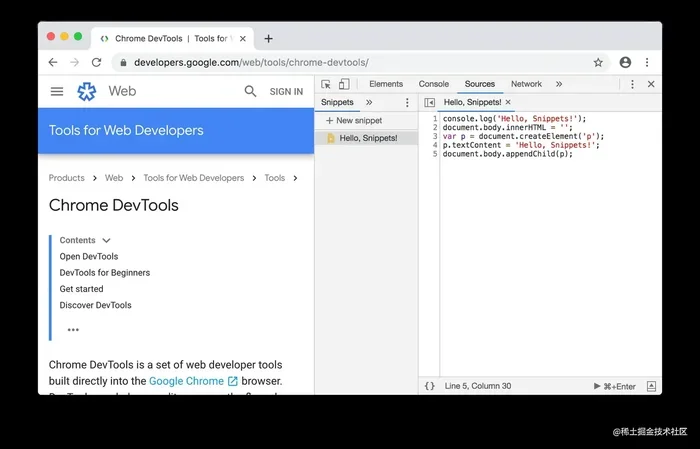
When you open Dev Tools, you will see a panel at the bottom or side of your browser. It is split into several tabs. Each tab serves a different purpose. The main ones include Elements, Console, Sources, Network, Performance, and Application. Do not worry if they look overwhelming right now. We will go through each one in detail.
Understanding the Dock Positions
You can move the Dev Tools panel to different positions. Click the three-dot menu in the top-right corner of the panel. You can dock it to the bottom, right, left, or even open it in a separate window. Pick whichever layout feels most comfortable for your workflow. Over time, you will develop a preference, and that is perfectly fine.
Inspecting and Editing Elements
The Elements panel is where most people start. It is also the most immediately useful part of Chrome Dev Tools. This panel lets you see and modify the HTML and CSS of any webpage in real time.
How to Inspect an Element
To inspect an element, right-click on anything on a webpage and select “Inspect.” The Dev Tools panel will open, and the corresponding HTML will be highlighted. You will see the exact code that builds that part of the page. This is incredibly helpful when you want to understand how a site is structured.
Editing HTML and CSS Live
Here is where things get fun. You can double-click any HTML tag or CSS property and change it right there. The webpage updates instantly so you can see the result. This is perfect for testing ideas quickly without touching the actual source code.
For example, you can change a button color, adjust a font size, or hide an element entirely. These changes only affect your local view. They do not change the live website. This makes Dev Tools a safe sandbox for experimentation.
Using the Element Selector Tool
At the top-left corner of the Elements panel, you will see a small arrow icon. Click it, and then hover over any part of the webpage. The corresponding HTML element will highlight. Click to select it, and you will jump straight to that code in the panel. This is a huge time-saver when you are trying to find a specific element.
Using the Console for JavaScript Debugging
The Console tab is one of the most powerful features of Chrome Dev Tools. It serves as a command line for JavaScript and displays error messages, warnings, and logs from the webpage.
Reading Console Messages
When something goes wrong on a webpage, the Console often tells you why. Red error messages mean something broke. Yellow warnings mean something might not work as expected. Learning to read these messages is a fundamental debugging skill.
Each error message includes a line number and file name. Click on any error, and Dev Tools will jump straight to the problematic code in the Sources panel. This makes finding and fixing bugs much faster.
Running JavaScript Commands
You can type JavaScript directly into the Console and press Enter to run it. This is great for testing small snippets of code or interacting with the page in real time. For example, you can type document.title to see the current page title, or document.querySelector('h1').style.color = 'red' to change the color of the first heading on the page.
You can also use console.log() to print values and variables. This is one of the simplest and most effective debugging techniques available. Whenever you are unsure what a variable contains, log it to the Console and check.
Clearing the Console
Over time, the Console can fill up with messages. You can clear it by clicking the trash can icon or by typing clear() and pressing Enter. A clean Console makes it much easier to focus on the messages that matter.
Mastering the Network Tab
The Network tab is essential for understanding how a webpage loads. It shows every request the browser makes, including HTML files, images, scripts, stylesheets, and API calls.
What You Will See
When you open the Network tab and reload a page, you will see a list of all the requests that happen. Each row shows the file name, status code, type, and how long it took to load. You can sort by any column to find the slowest or largest files.
This information is gold when you are trying to speed up a website. You can quickly identify large images, slow server responses, or blocking scripts that are holding things back.
Filtering Network Requests
The Network tab has built-in filters that help you narrow down the results. You can filter by resource type, such as images, scripts, or XHR (XMLHttpRequest) calls. You can also use the search bar to find specific files by name.
For example, if you want to check all the JavaScript files a page loads, just click the "JS" filter. If you want to find a specific image, type part of the file name in the search bar. These small tricks save a ton of time.
Throttling Network Speed
One of the most useful features of the Network tab is the ability to simulate slower internet connections. You can select different throttling profiles like "Slow 3G" or "Fast 3G." This helps you understand how your site performs for users on slower connections.
Testing under different network conditions is a best practice that every developer should adopt. It helps you build faster, more resilient websites that work well for all users.
Performance Profiling and Optimization
The Performance tab lets you record and analyze how a webpage behaves over time. It is one of the most advanced features of Chrome Dev Tools, but it is also one of the most rewarding to learn.
Recording a Performance Profile
To record a performance profile, open the Performance tab and click the record button (the circle icon). Then interact with the page normally. Click around, scroll, type in forms, and do whatever a typical user would do. When you are done, click the record button again to stop.
The tool will generate a detailed timeline showing CPU activity, rendering, painting, and network requests. You can play back the recording and see exactly what happened, frame by frame.
Reading the Performance Timeline
The timeline can look intimidating at first, but the key sections are straightforward. The main areas to look at are:
- FPS (Frames Per Second): Shows how smoothly the page scrolls and animates. Drops below 60 FPS indicate jank.
- CPU: Shows how much processing power the page is using. Spikes can indicate heavy scripts or inefficient code.
- Network: Shows all the loading requests during the recording period.
By analyzing these areas, you can pinpoint exactly what is slowing down your page. Maybe a large script is blocking the main thread. Maybe an animation is causing excessive repaints. Dev Tools will show you where the problem lies.
Memory and Rendering Tools
Beyond the Performance tab, Chrome also offers Memory and Rendering tools. The Memory panel helps you find memory leaks by tracking how much memory a page uses over time. The Rendering panel lets you visualize paint flashing, layout shifts, and scroll performance issues.
These tools are especially useful for complex web applications where performance problems can be hard to spot with the naked eye.
Mobile Emulation and Responsive Testing
One of the best features of Chrome Dev Tools is the ability to test your website on different devices without owning them. The device toolbar lets you emulate various screen sizes, resolutions, and even mobile network conditions.
How to Enable Device Mode
Click the device toggle icon in the top-left corner of Dev Tools (it looks like a phone and tablet). The browser window will switch to a responsive viewport. You can then pick a device from the dropdown menu, such as iPhone, Pixel, or iPad.
You can also set a custom resolution by typing in your own width and height values. This is useful when you need to test a specific screen size that is not in the preset list.
Testing Touch Interactions
Device mode also simulates touch events. You can click and drag on the emulated screen just like you would on a real phone. This helps you test how touch-based interactions work on your site.
You can also simulate different network conditions while in device mode. This gives you a realistic picture of how your site performs on mobile devices with slower connections.
Why Mobile Testing Matters
More than half of all web traffic comes from mobile devices. If your site does not work well on phones and tablets, you are losing a huge portion of your audience. Using the mobile emulation features in Dev Tools helps you catch responsive design issues before they become real problems for your users.
Workflow Tips and Shortcuts
Once you understand the basics of Chrome Dev Tools, you can start building a faster, more efficient workflow. The right shortcuts and habits can cut your development time in half.
Essential Keyboard Shortcuts
Here are some of the most useful shortcuts to memorize:
- Ctrl + Shift + I (Cmd + Option + I on Mac): Opens Dev Tools.
- Ctrl + Shift + C (Cmd + Shift + C on Mac): Opens the element selector directly.
- Ctrl + F (Cmd + F on Mac): Searches for text within the current panel.
- Ctrl + Shift + P (Cmd + Shift + P on Mac): Opens the Command Menu for quick access to any tool.
- Ctrl + Shift + M (Cmd + Shift + M on Mac): Toggles device mode instantly.
Learning these shortcuts alone will make you noticeably faster. Try to use them every day until they become second nature.
Customizing Dev Tools
Dev Tools is highly customizable. You can change the theme from light to dark, adjust font sizes, and set preferences for how panels behave. Go to the Settings panel (the gear icon) to explore these options.
Many developers prefer the dark theme because it reduces eye strain during long coding sessions. You can also pin frequently used panels so they stay open even when you close and reopen Dev Tools.
Using Workspaces for Direct File Editing
One of the most powerful features for developers is Workspaces. This allows you to map local files on your computer to files in the browser. When you make changes in Dev Tools, they save directly to your local files. This means you can edit code in the browser and see it reflected in your project without copying and pasting.
To set up Workspaces, go to the Sources panel, right-click on the file navigator, and select "Add Folder to Workspace." Map it to your project folder, and you are all set.
Saving Changes for Later
When you make edits in Dev Tools, they are temporary by default. But with Workspaces enabled, you can persist those changes to your actual project files. This is incredibly useful for quick fixes or testing changes before committing them to your codebase.
It is worth noting that some users have compared workflow efficiency tools to how long a generator can run continuously without performance drops. Just like a reliable power source keeps your house running, efficient Dev Tools keep your workflow running smoothly without interruptions.
Common Mistakes and How to Avoid Them
Even experienced developers make mistakes when using Chrome Dev Tools. Here are a few common pitfalls and how to avoid them.
- Forgetting to clear the cache: Sometimes Dev Tools shows old versions of files. Clear your browser cache or do a hard refresh (Ctrl + Shift + R) to see the latest changes.
- Making changes directly on live sites: Remember that changes in Dev Tools only affect your local view. Do not assume your edits are saved to the actual website.
- Ignoring console warnings: Warnings are easy to overlook, but they often point to real problems that will cause issues down the road. Always review them.
- Not using the Command Menu: Many users stay in the same panels they always use. The Command Menu (Ctrl + Shift + P) gives you instant access to every tool and setting in Dev Tools. Use it.
- Overlooking the Application panel: This panel lets you inspect cookies, local storage, session storage, and service workers. It is essential for debugging authentication and caching issues.
Avoiding these mistakes will save you frustration and help you get the most out of your Chrome Dev Tools experience. Think of them as guardrails that keep you on the right track.
Conclusion
How to use dev tools in chrome is a skill that pays dividends every single day. From inspecting elements and debugging JavaScript to profiling performance and testing on mobile devices, these tools cover nearly every aspect of web development. The learning curve is gentle, but the payoff is enormous.
Start with the basics. Open Dev Tools today and explore the Elements and Console panels. Then gradually work your way through the Network, Performance, and Application tabs. Within a few weeks, you will wonder how you ever worked without them. The more you practice, the more natural it becomes. Your workflow will get faster, your debugging will get smarter, and your websites will get better. So go ahead, press F12, and start exploring. Your future self will thank you.
Just as you would not try to power your house with a generator without understanding its capacity, you should not build websites without understanding the tools that power your workflow. Chrome Dev Tools gives you that understanding, one panel at a time.
Keep experimenting. Keep learning. And remember that every expert was once a beginner. The tools are there. The knowledge is here. All you have to do is start using them.
Frequently Asked Questions
What is Chrome Dev Tools used for?
Chrome Dev Tools is used for inspecting and debugging websites directly in the browser. Developers use it to edit HTML and CSS, debug JavaScript, analyze network requests, profile performance, and test responsive designs. It is an all-in-one toolkit built into Google Chrome.
How do I open Dev Tools in Chrome?
You can open Dev Tools by pressing F12 on Windows or Command + Option + I on Mac. You can also right-click anywhere on a webpage and select "Inspect," or go to the Chrome menu, click More Tools, and choose Developer Tools.
Can I use Dev Tools to edit a live website?
You can edit the HTML and CSS of a live website in Dev Tools, but those changes only affect your local browser view. They do not get saved to the actual website. To make permanent changes, you need to edit the source files on your computer or server.
Is Chrome Dev Tools only for web developers?
Not at all. While web developers use it the most, anyone can benefit from Chrome Dev Tools. Designers use it to inspect styles, content creators use it to understand page structure, and even regular users can use it to troubleshoot loading issues or check how a site works behind the scenes.
What is the Performance tab used for?
The Performance tab records and analyzes how a webpage behaves over time. It shows CPU usage, frame rates, rendering activity, and network requests during a recording session. Developers use it to find performance bottlenecks like slow scripts, excessive repaints, or memory leaks.
How do I test my website on mobile using Dev Tools?
Click the device toggle icon in Dev Tools (it looks like a phone and tablet) to enter device mode. You can then select a device from the dropdown, such as iPhone or Pixel, and the browser window will emulate that screen size. You can also simulate touch interactions and slower network speeds.
=== CONCLUSION ===
Mastering how to use dev tools in chrome is one of the best investments you can make in your web development career. The tools are free, powerful, and always available right inside your browser. Start small, practice regularly, and build your confidence one panel at a time. Before long, you will be working faster, debugging smarter, and building better websites than ever before.