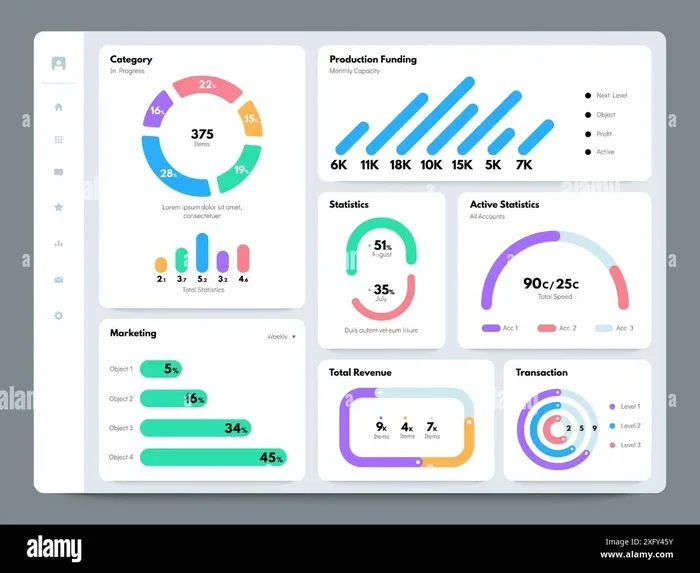
What Are Data Analysis Tools And Why They Are Important
Data analysis tools are software programs that help you collect, process, and interpret data to make smarter decisions. They turn raw numbers into clear insights that drive growth and efficiency. Whether you are a small business owner or a data scientist, the right data analysis tool can save you time and reveal hidden patterns in your information.
Have you ever looked at a huge spreadsheet and felt completely lost? You are not alone. Every day, businesses around the world generate massive amounts of data. But raw data alone does not do anyone any good. That is where data analysis tools come in. These powerful programs help people make sense of numbers, find patterns, and turn information into action. In this guide, we will break down exactly what these tools are, why they matter, and how you can pick the best one for your needs.
The world runs on data now. From online stores tracking customer behavior to hospitals monitoring patient outcomes, everyone needs a way to understand their information. Data analysis tools make this possible. They do the heavy lifting so you do not have to manually crunch numbers for hours. Whether you are a beginner just getting started or a seasoned professional, there is a tool out there that fits your needs. Let us dive in and explore everything you need to know.
Key Takeaways
- What they are: Data analysis tools are programs designed to clean, process, and visualize data for better understanding.
- Why they matter: They help businesses make faster, more accurate decisions based on real evidence.
- Types available: Options range from simple spreadsheets to advanced machine learning platforms.
- Choosing the right one: Consider your budget, skill level, data size, and specific goals before picking a tool.
- Common mistakes: Avoid choosing tools that are too complex or ignoring data quality issues.
- Future trends: AI-powered analytics and real-time processing are shaping the next generation of tools.
📑 Table of Contents
What Are Data Analysis Tools?
At their core, data analysis tools are software applications designed to help you collect, clean, process, and visualize data. Think of them as a smart assistant for your numbers. Instead of scrolling through thousands of rows in a spreadsheet, these tools can spot trends, create charts, and even make predictions about future outcomes.
The goal of any data analytics software is simple: turn messy, raw data into clear and useful insights. These insights help businesses, researchers, and individuals make better choices. Without these tools, analyzing large datasets would take forever and be full of errors. Let us look at the different types available so you can understand the full picture.
Types of Data Analysis Tools
Not all data analysis tools are the same. They come in different shapes and sizes, each built for specific purposes. Here are the main categories you will encounter:
- Spreadsheet tools: Programs like Microsoft Excel and Google Sheets are great for small to medium datasets. They are beginner-friendly and widely used.
- Programming languages: Python and R are powerful languages built specifically for statistical analysis and data science work.
- Business intelligence platforms: Tools like Tableau and Power BI focus on creating interactive dashboards and visualizations.
- Big data platforms: Apache Hadoop and Spark handle massive datasets that regular tools cannot manage.
- ETL tools: Extract, transform, and load tools help you move data between different systems efficiently.
Each type serves a different purpose. A small business owner might start with a simple spreadsheet, while a large corporation might need a full big data platform. The key is matching the tool to your specific situation.
Why Data Analysis Tools Are Important
You might wonder why data analysis tools are such a big deal. Can you not just use a calculator or a basic spreadsheet? Well, yes and no. For simple tasks, those work fine. But when your data grows in size and complexity, you need something more powerful. Here is why these tools are so important.
Better Decision Making
The biggest advantage of using data analytics software is that it helps you make decisions based on evidence, not guesses. Instead of relying on gut feelings, you can look at actual numbers and trends. This leads to smarter choices in every area of business, from marketing campaigns to product development. When you can see what is really happening in your data, you act with confidence.
Saving Time and Reducing Errors
Manual data processing is slow and prone to mistakes. A single typo in a spreadsheet can throw off an entire analysis. Data analysis tools automate repetitive tasks and reduce human error. What might take a person hours to do by hand can be completed in minutes with the right software. This speed lets teams focus on higher-value work like strategy and creativity.
Finding Hidden Patterns
Here is something amazing about data processing tools: they can find patterns that humans would never notice. Maybe sales always dip in January, or certain customers are more likely to return after a specific email campaign. These insights are buried deep in the data, and without proper tools, they stay hidden. Advanced analytics can surface these patterns and give you a real competitive edge.
Scalability
As your business grows, so does your data. What worked for 100 records will not work for 10 million. Data analysis tools scale with your needs. Whether you have a small dataset today or expect to handle massive volumes tomorrow, there is a solution that can grow alongside you. This scalability is essential for long-term success in a data-driven world.
Popular Data Analysis Tools You Should Know
The market is full of options, which can feel overwhelming. Let us walk through some of the most popular data analysis tools and what makes each one special. Understanding these options will help you narrow down your choices.
Spreadsheet Tools
Microsoft Excel remains the most widely used data analysis tool in the world. It is familiar, powerful, and comes with built-in functions for everything from basic calculations to complex statistical modeling. Google Sheets is a close competitor, offering cloud-based collaboration and free access. Both are excellent starting points for beginners and still useful for experts who need quick analysis on the go.
Spreadsheet tools shine when you are working with structured data and need fast results. They are perfect for budgeting, simple reporting, and data cleaning tasks. However, they do have limits when handling very large datasets or advanced statistical analysis.
Programming Languages for Data Analysis
For more advanced work, programming languages like Python and R are top choices. Python is incredibly versatile and has a huge library ecosystem, including pandas, NumPy, and scikit-learn for machine learning tools and data manipulation. R was built specifically for statistics and is favored by researchers and data scientists.
These languages offer unmatched flexibility. You can build custom workflows, automate complex processes, and handle datasets of almost any size. The trade-off is a steeper learning curve. If you are willing to invest time in learning, Python and R open up endless possibilities for data visualization and advanced analytics.
Business Intelligence Platforms
Tableau and Microsoft Power BI are two leading business intelligence platforms that focus on visualization and reporting. They connect to various data sources, build beautiful interactive dashboards, and let non-technical users explore data on their own. These platforms are perfect for teams that need to share insights across an organization.
With drag-and-drop interfaces, you do not need to know how to code to create powerful data visualizations. You can build dashboard tools that update in real time and give stakeholders a clear view of key metrics. This accessibility makes BI platforms a favorite choice for companies of all sizes.
Big Data and Cloud-Based Analytics
When your data gets really big, you need serious infrastructure. Platforms like Apache Hadoop and Apache Spark handle distributed processing across clusters of computers. Cloud-based solutions from Amazon Web Services, Google Cloud, and Microsoft Azure also offer powerful cloud-based analytics services that scale on demand.
These tools are designed for organizations dealing with big data platforms and massive datasets. They handle data warehousing, complex queries, and real-time processing with ease. While they are more complex to set up, they are essential for enterprises that need to analyze petabytes of information.
How to Choose the Right Data Analysis Tool
Choosing the right data analysis tool does not have to be complicated. If you ask yourself a few key questions, the decision becomes much clearer. Here is a practical guide to help you pick the best option.
Start with your goals. What do you want to achieve? Are you building charts for a weekly report, or are you training a machine learning model? Your goal determines the type of tool you need. Simple reporting calls for a BI platform, while advanced modeling might require Python or R.
Consider your skill level. Be honest about what you know. If you are not a programmer, a spreadsheet or a visual BI tool will serve you better than a coding-based solution. On the other hand, if you have technical skills, you can unlock much more power with programming languages and advanced platforms.
Think about your data size. Small datasets work fine in Excel. But if you are dealing with millions of rows, you will need something more robust. Consider whether your tool can handle your current data volume and grow with you over time.
Set a budget. Some tools are free and open-source, while others require expensive subscriptions. Open-source analytics tools like Python, R, and Apache Superset offer powerful capabilities at no cost. Commercial tools like Tableau and Power BI come with support and polished interfaces but at a price. Weigh your options carefully.
Check integration options. Your data analysis tool should work well with your existing systems. If you use Salesforce for customer data and Google Analytics for web traffic, make sure your chosen tool can connect to both. Smooth integration saves time and reduces data silos.
Common Mistakes When Using Data Analysis Tools
Even with the best data analysis tools, people still make mistakes that undermine their results. Being aware of these pitfalls can save you a lot of frustration.
- Ignoring data quality: Garbage in, garbage out. If your source data is messy or incomplete, your analysis will be wrong no matter how good your tool is. Always clean and validate your data first.
- Choosing tools that are too complex: Just because a tool is powerful does not mean it is right for you. Overly complex tools lead to frustration and underused capabilities.
- Skipping documentation: Document your processes and assumptions. If you do not write down how you arrived at your conclusions, others cannot verify or build on your work.
- Overlooking visualization: Numbers alone do not tell the full story. Good data visualization makes your findings accessible and actionable for everyone, not just technical experts.
- Not keeping up with updates: The data analytics software landscape changes fast. New features and tools emerge regularly. Staying updated ensures you are using the best available methods.
Avoiding these mistakes will help you get the most out of any data analysis tool you choose. It is not just about the software, it is about how you use it.
The Future of Data Analysis Tools
The world of data analysis tools is evolving rapidly. Artificial intelligence and machine learning are making their way into everyday analytics. Tools are becoming smarter and more intuitive, able to suggest insights and automate complex workflows with minimal human input. Real-time analytics is another major trend, allowing businesses to make decisions the moment data comes in rather than waiting for daily or weekly reports.
Natural language processing is also changing the game. Soon, you may be able to ask your tool questions in plain English and get instant answers. This democratization of data means that more people than ever can access and understand powerful insights without needing technical expertise. The future of data analysis is exciting, accessible, and incredibly powerful.
As these tools continue to evolve, the key is staying curious and adaptable. The best data analysis tool for you today might not be the best one next year. Keep learning, keep experimenting, and always look for ways to extract more value from your data.
Final Thoughts
Data analysis tools are essential for anyone who wants to make sense of the world through data. They save time, reduce errors, and uncover insights that would otherwise stay hidden. Whether you start with a simple spreadsheet or dive into advanced programming, the right tool transforms raw numbers into clear, actionable knowledge. The most important step is to start somewhere. Pick a tool that matches your current needs, learn it well, and grow from there. The world of data analytics is vast, but with the right approach, anyone can become a confident data user.
Remember, tools are only as good as the questions you ask of them. Define your goals, maintain clean data, and always look for the story behind the numbers. With practice and the right data analysis software, you will be making smarter, faster decisions in no time.
Frequently Asked Questions
What is the easiest data analysis tool for beginners?
Microsoft Excel and Google Sheets are the easiest data analysis tools for beginners. They use familiar interfaces, require no coding, and come with built-in functions for basic calculations and charts. Most people already have some experience with spreadsheets, which makes the learning curve very gentle.
Do I need to know how to code to use data analysis tools?
No, many modern data analytics software options do not require any coding at all. Business intelligence platforms like Tableau and Power BI use visual, drag-and-drop interfaces. However, learning to code with Python or R does open up much more advanced capabilities for those who want to go deeper.
What is the difference between data analysis and data analytics?
Data analysis focuses on examining data to find patterns and answer specific questions. Data analytics is a broader field that includes analysis but also involves using insights to make predictions and drive decisions. The tools overlap, but analytics tends to be more strategic and forward-looking.
Are there free data analysis tools available?
Yes, there are many excellent open-source analytics tools available for free. Python, R, Apache Superset, and Google Sheets all offer powerful capabilities without any cost. These free options are perfect for individuals, students, and small businesses just getting started with data analysis.
How do I know if a data analysis tool is right for my business?
Ask yourself three questions: What is your budget, what is your skill level, and how large is your dataset? If you need quick visual reports and have a small team, a BI platform works well. If you have technical staff and massive datasets, consider programming languages or big data platforms.
Can data analysis tools handle real-time data?
Yes, many modern data analysis tools support real-time or near-real-time processing. Cloud-based platforms and streaming analytics solutions can process incoming data instantly and update dashboards on the fly. This capability is especially valuable for industries like finance, e-commerce, and logistics where timing matters.